Visa Bulletin is one of the most important concepts in U.S. immigration. It’s a monthly publication that defines “cutoff” dates, which determine who can submit a green card application such as I-485, and more importantly, whose application may be approved.
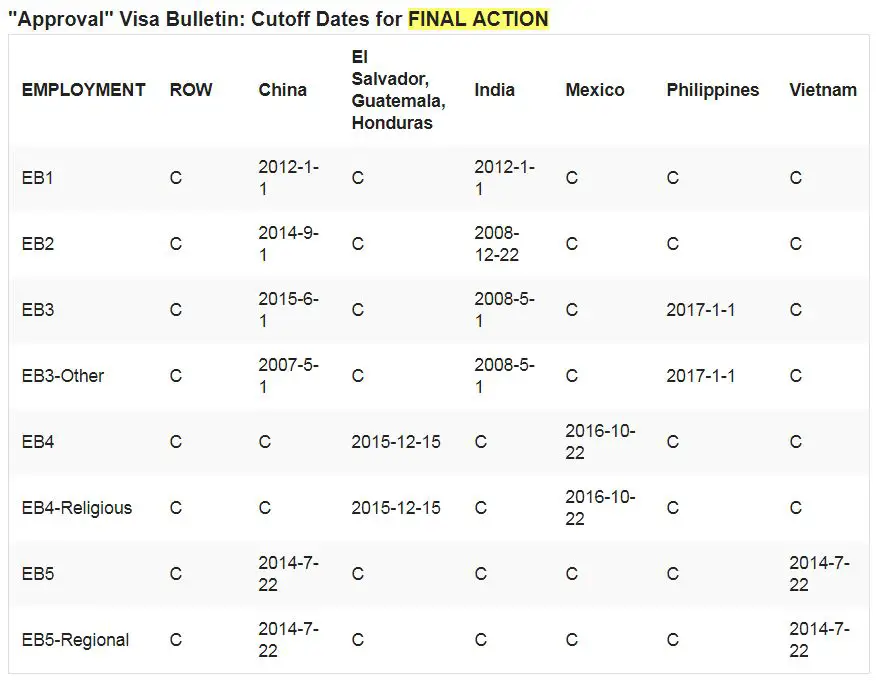
But the Visa Bulletin is basically a series of tables with a bunch of dates, like this:
What if you want to see cutoff date movement from month to month, for your own category? Well, you can’t. The U.S. government doesn’t provide such a tool, but we do. It’s something like this:
![]()
All data are provided by the Department of State, the government authority in charge of publishing visa bulletins. We simply present them in a much easier way to understand, and managed to integrate years of cutoff dates into one graph. The page is here: Visa Bulletin Tracker (Employment-Based).
Moving your mouse over a curve will tell you the cutoff date and corresponding visa bulletin, and you can also zoom in or out to see more details.
Not only you can see the trend of your own category, you can also compare with other groups. For example, if you belong to China EB2, you’ll be able to see how China-EB2 cutoff dates moved as compared to India-EB2 or China EB-3, each month for the past 5+ years.
We don’t include EB1 and other employment based categories because for the most part they stay “Current”.
If you’re sponsored by a family member, we do cover every category: F1, F2A, F2B, F3 and F4. The page is here: Visa Bulletin Tracker (Family-Sponsored).
![]()
At ImmigrationRoad.com, we strive to provide free and easy-to-use tools that you can’t find anywhere else. For example, other than the interactive VB tracking graph, we also built several other visa bulletin tools that you might find useful. Immigration is a long and demanding process, we’re just trying to make it a little bit easier.
![]()
