Illegal aliens, undocumented immigrants, or unauthorized residents, no matter which term is used, all refer to people who live in the United States but do not have proper government authorization. This population includs mostly two groups: individuals who entered the U.S. without inspection, and non-immigrant visitors who entered the U.S. legally but over stayed their visas.
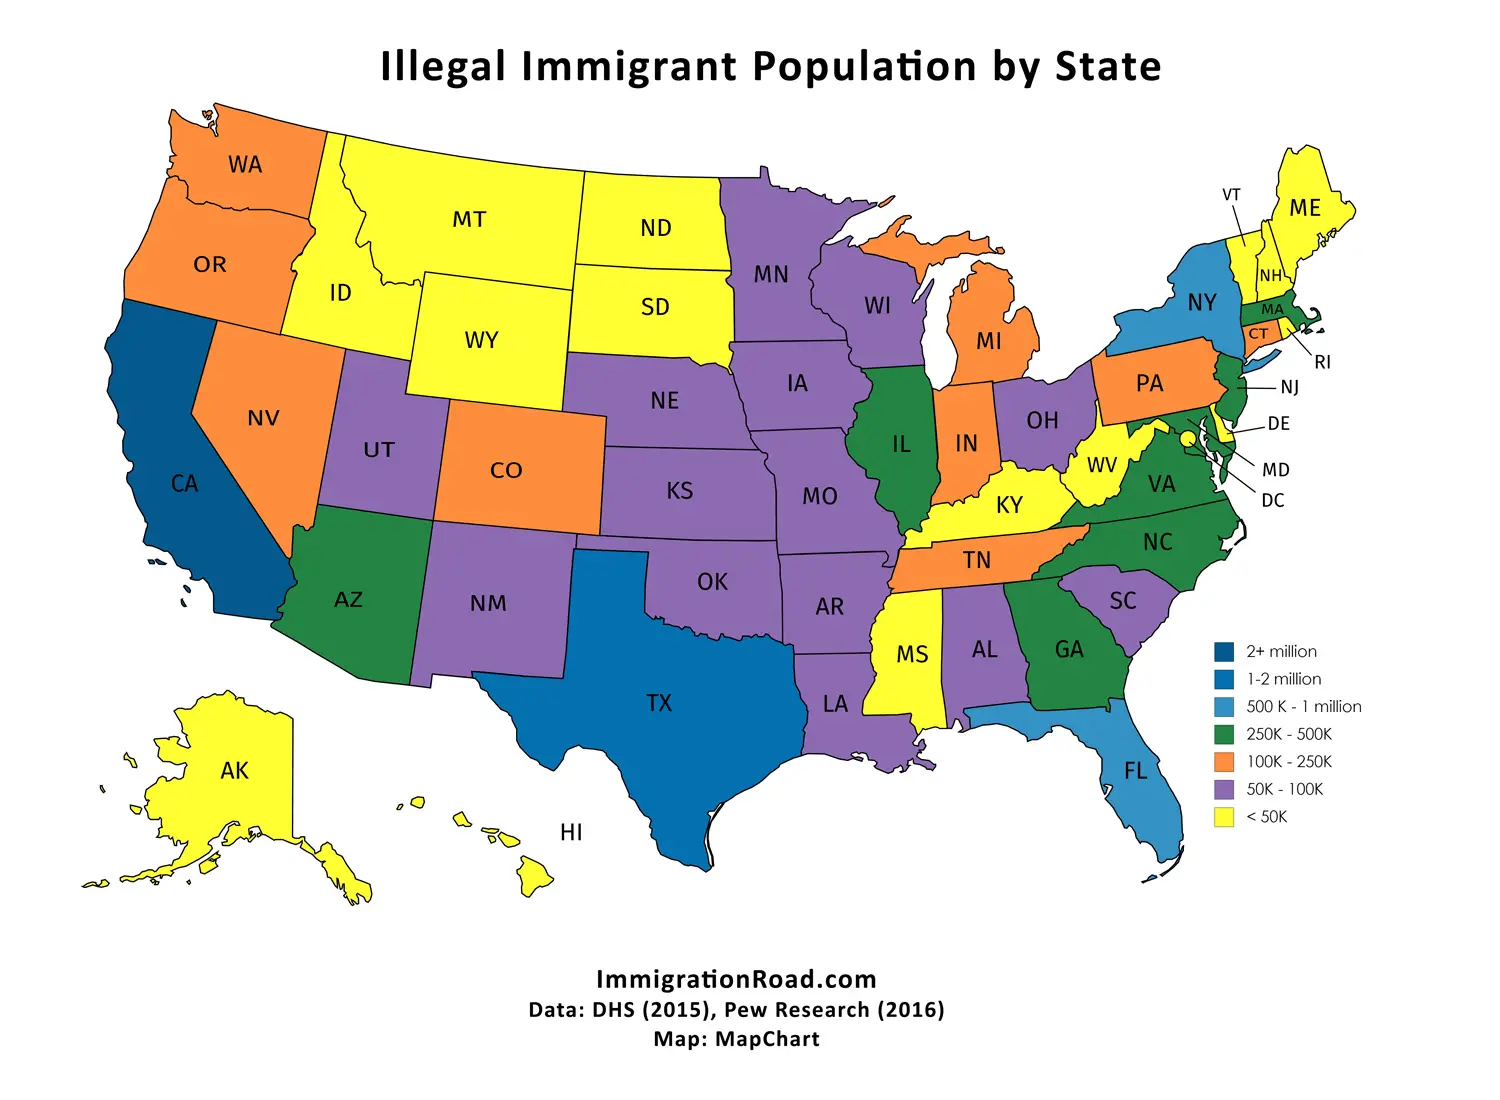
The map below shows estimates of illegal immigrant population by state of residence, using data from the Department of Homeland Security (2015) and Pew Research Center (2016). Click on image to see larger map.
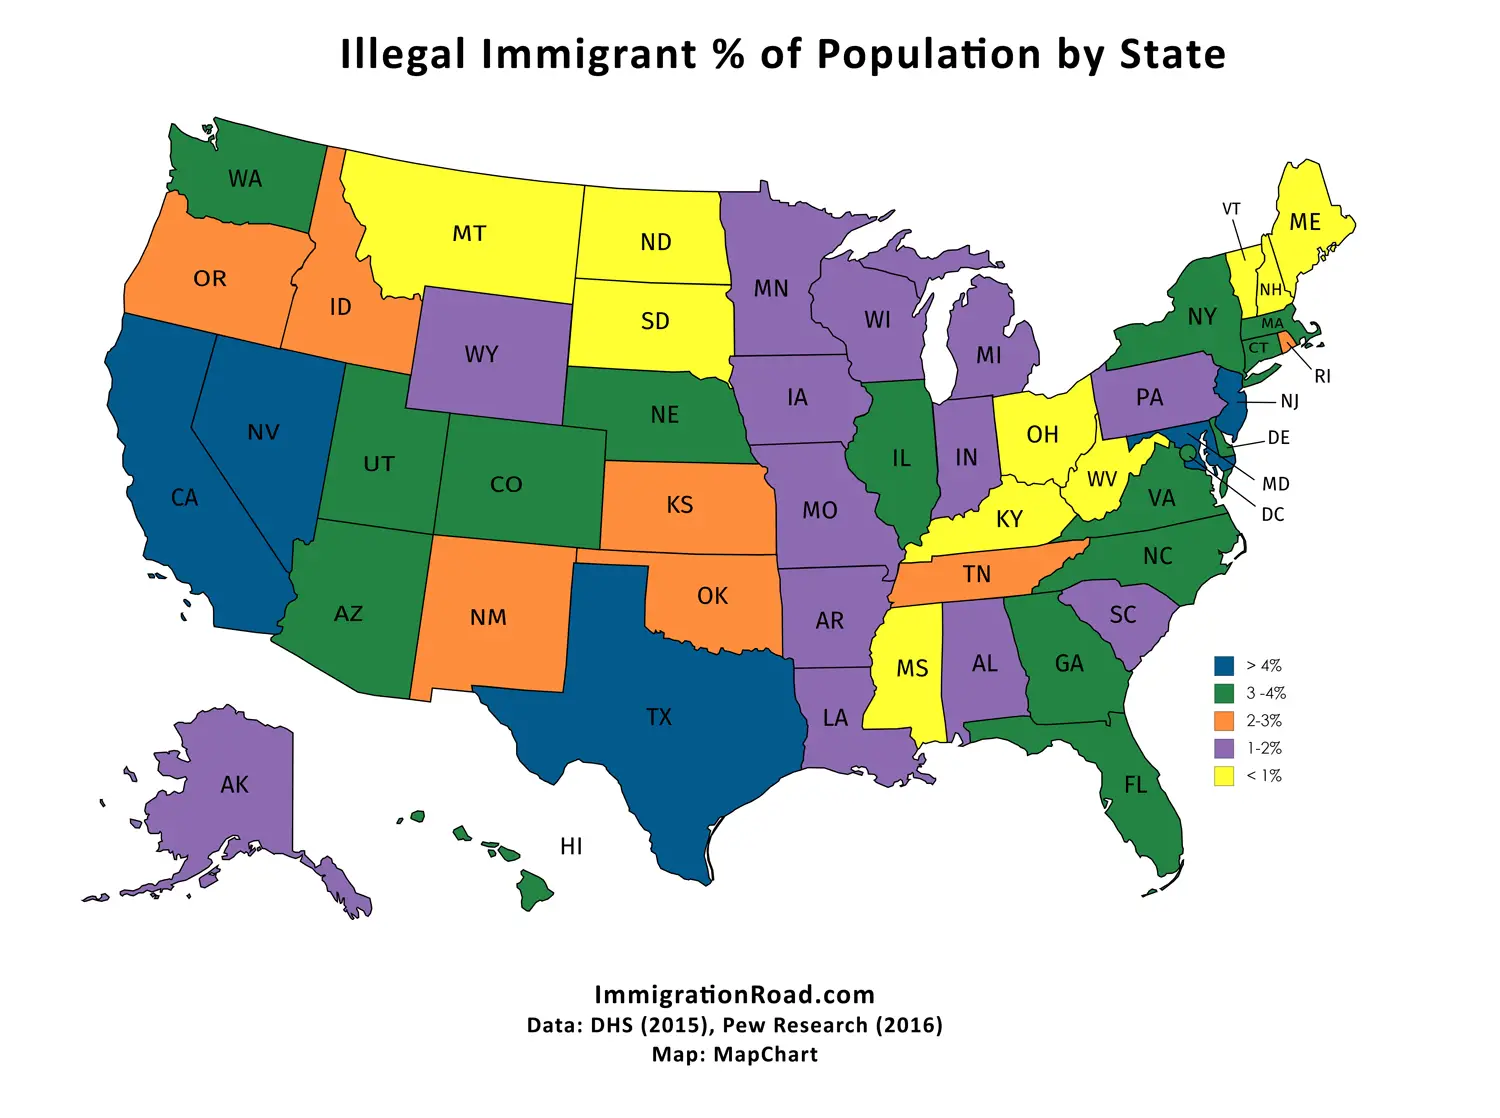
The following map shows estimates of illegal immigrant as a percentage of the state population, using the same data from DHS (2015) and Pew Research Center (2016). Click on image to see larger map.
See also: Statistics of new permanent residents by state
Source: Office of Immigration Statistics, US Department of Homeland Security (2015); Pew Hispanic Center (2016).
Table 1: DHS 2015 Data, Comparision between 2015 and 2010.
| Table 1 | 2015 | 2010 | |||
| State of Residence | Number | Percent of Total | Number | Percent of Total |
Percent Increase |
| U.S.A. | 11,960,000 | 100 | 11,590,000 | 100 | 3 |
| California | 2,880,000 | 24 | 2,910,000 | 25 | -1 |
| Texas | 1,940,000 | 16 | 1,780,000 | 15 | 9 |
| Florida | 810,000 | 7 | 730,000 | 6 | 10 |
| New York | 590,000 | 5 | 690,000 | 6 | -15 |
| Illinois. | 450,000 | 4 | 550,000 | 5 | -18 |
| New Jersey | 440,000 | 4 | 440,000 | 4 | -1 |
| Georgia | 390,000 | 3 | 430,000 | 4 | -9 |
| North Carolina | 390,000 | 3 | 390,000 | 3 | -1 |
| Arizona | 380,000 | 3 | 350,000 | 3 | 6 |
| Virginia | 310,000 | 3 | 220,000 | 2 | 43 |
| Other states | 310,000 | 3 | 220,000 | 2 | 10 |
Table 2: DHS 2015 Data, Illegal Immigrants Population by Country of Birth
| Table 2 | 2015 | 2010 | |||
| Country of Birth | Number | Percent of Total | Number | Percent of Total | Percent Increase |
| All countries. | 11,960,000 | 100 | 11,590,000 | 100 | 3 |
| Mexico | 6,580,000 | 55 | 6,830,000 | 59 | -4 |
| El Salvador | 750,000 | 6 | 670,000 | 6 | 13 |
| Guatemala | 620,000 | 5 | 520,000 | 4 | 19 |
| India | 470,000 | 4 | 270,000 | 2 | 76 |
| Honduras | 440,000 | 4 | 380,000 | 3 | 14 |
| Philippines | 370,000 | 3 | 290,000 | 2 | 27 |
| China | 320,000 | 3 | 300,000 | 3 | 6 |
| Korea | 230,000 | 2 | 220,000 | 2 | 9 |
| Vietnam | 170,000 | 1 | 190,000 | 2 | -11 |
| Ecuador | 150,000 | 1 | 210,000 | 2 | -29 |
| Other countries | 1,870,000 | 16 | 1,720,000 | 15 | 9 |
Table 3: Pew 2016 Data
| State | Unauthorized immigrant population | Unauthorized immigrant % of population | Unauthorized immigrant % of all immigrants |
| U.S. | 10,700,000 | 3.30% | 24% |
| California | 2,200,000 | 5.60% | 20% |
| Texas | 1,600,000 | 5.70% | 33% |
| Florida | 775,000 | 3.80% | 18% |
| New York | 725,000 | 3.60% | 15% |
| New Jersey | 475,000 | 5.20% | 22% |
| Georgia | 400,000 | 3.80% | 36% |
| Illinois | 400,000 | 3.20% | 22% |
| North Carolina | 325,000 | 3.10% | 39% |
| Arizona | 275,000 | 3.90% | 28% |
| Maryland | 275,000 | 4.50% | 29% |
| Virginia | 275,000 | 3.40% | 27% |
| Massachusetts | 250,000 | 3.80% | 22% |
| Washington | 240,000 | 3.30% | 23% |
| Nevada | 210,000 | 7.10% | 35% |
| Colorado | 190,000 | 3.40% | 34% |
| Pennsylvania | 170,000 | 1.30% | 19% |
| Tennessee | 130,000 | 2.00% | 38% |
| Connecticut | 120,000 | 3.50% | 23% |
| Oregon | 110,000 | 2.60% | 26% |
| Indiana | 100,000 | 1.50% | 29% |
| Michigan | 100,000 | 1.00% | 15% |
| Minnesota | 95,000 | 1.70% | 20% |
| Utah | 95,000 | 3.20% | 38% |
| Ohio | 90,000 | 0.80% | 17% |
| Oklahoma | 85,000 | 2.20% | 38% |
| South Carolina | 85,000 | 1.70% | 35% |
| Kansas | 75,000 | 2.60% | 35% |
| Wisconsin | 75,000 | 1.30% | 24% |
| Louisiana | 70,000 | 1.50% | 36% |
| Missouri | 60,000 | 1.00% | 23% |
| Nebraska | 60,000 | 3.10% | 41% |
| New Mexico | 60,000 | 2.80% | 29% |
| Alabama | 55,000 | 1.20% | 34% |
| Arkansas | 55,000 | 1.90% | 41% |
| Iowa | 50,000 | 1.70% | 31% |
| Hawaii | 45,000 | 3.30% | 17% |
| Idaho | 35,000 | 2.20% | 37% |
| Kentucky | 35,000 | 0.80% | 22% |
| Delaware | 30,000 | 3.00% | 31% |
| Rhode Island | 30,000 | 2.80% | 19% |
| District of Columbia | 25,000 | 3.80% | 28% |
| Mississippi | 20,000 | 0.70% | 35% |
| New Hampshire | 10,000 | 0.70% | 13% |
| Alaska | 5,000 | 1.00% | 13% |
| North Dakota | 5,000 | 0.70% | 23% |
| South Dakota | 5,000 | 0.70% | 19% |
| Wyoming | 5,000 | 1.20% | 32% |
| Maine | <5,000 | 0.40% | 9% |
| Montana | <5,000 | 0.30% | 12% |
| Vermont | <5,000 | 0.10% | 4% |
| West Virginia | <5,000 | 0.20% | 14% |
Table 4: Archived Data from DHS: 2010 January Estimates of Illegal Immigrants
State of Residence of the Unauthorized Immigrant Population: January 2000 and 2005-2010 | ||||||
Estimated population in January of 2010 - DHS | ||||||
| State of Residence | 2005 | 2006 | 2007 | 2008 | 2009 | 2010 |
| All States | 10,490,000 | 11,310,000 | 11,780,000 | 11,600,000 | 10,750,000 | 10,790,000 |
| California | 2,770,000 | 2,790,000 | 2,840,000 | 2,850,000 | 2,600,000 | 2,570,000 |
| Texas | 1,360,000 | 1,620,000 | 1,710,000 | 1,680,000 | 1,680,000 | 1,770,000 |
| Florida | 850,000 | 960,000 | 960,000 | 840,000 | 720,000 | 760,000 |
| Illinois | 520,000 | 530,000 | 560,000 | 550,000 | 540,000 | 490,000 |
| Arizona | 480,000 | 490,000 | 530,000 | 560,000 | 460,000 | 470,000 |
| Georgia | 470,000 | 490,000 | 490,000 | 460,000 | 480,000 | 460,000 |
| New York | 560,000 | 510,000 | 640,000 | 640,000 | 550,000 | 460,000 |
| North Carolina | 360,000 | 360,000 | 380,000 | 380,000 | 370,000 | 390,000 |
| New Jersey | 380,000 | 420,000 | 470,000 | 400,000 | 360,000 | 370,000 |
| Nevada | 240,000 | 230,000 | 260,000 | 280,000 | 260,000 | 260,000 |
| Other states | 2,510,000 | 2,900,000 | 2,950,000 | 2,950,000 | 2,730,000 | 2,790,000 |
Other Immigration Statistics: