The United States Citizenship and Immigration Services (USCIS) published I-140 approval/denial statistics yesterday. However, the data is confusing.
Table A is for E-11, which is supposed to be only for Alien of Extraordinary Ability petitions (aka EB-1a). But the description indicates “E-11 Extraordinary Ability, Professors, Researchers, or Executives,” which apparently covers all EB1 categories.
Table B is for E-12, Outstanding Professor or Researcher petitions (EB-1b), but the description says “EB-2 Exceptional Ability in the Sciences, Arts, or Business.”
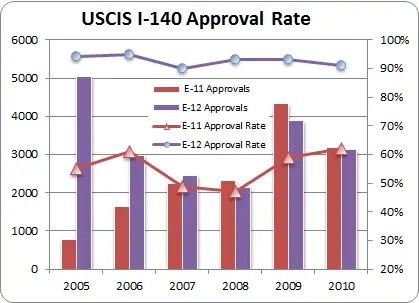
By the numbers, it appears that the tables are only for E-11 and E-12. Hopefully USCIS will provide clarification shortly.
Below is a graph that shows the total number of I-140 approvals and the approval rate for a given fiscal year. The denial rate equals (100% – approval rate).

Update 2/28: USCIS has modified the descriptions and the data are indeed for E11 and E12 only.

Thanks for the clarification. Do you know if USCIS will publish approval rate for other EBs?